I always thought it would be interesting to examine the commits for my book using some data visualization. It would be a way to visualize all the work I’ve been doing. This thought simmered as a side project for many months, then in November I installed GitLab. Once I uploaded my book’s repository into GitLab, I had a few visualizations that were interesting.
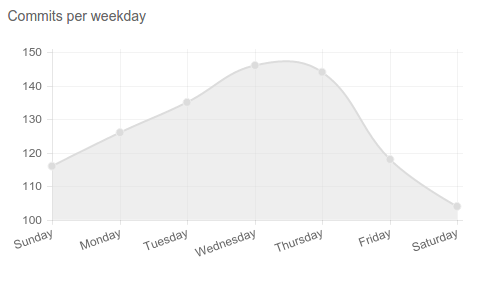
Clearly I’m busier during the middle of the week than towards the end of the week. And it looks like Saturday might well be a considered a day off as far as working on the book goes.
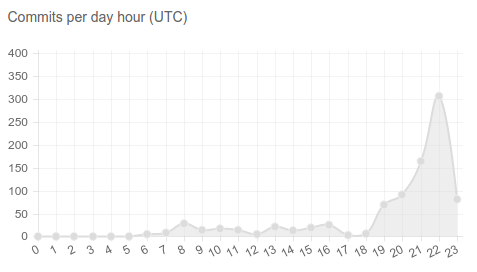
This shows that this book is clearly an after-hours project. I do manage to sneak in a few commits during the business day, and I would have to guess those are notes or scripts as opposed to actual manuscript writing.
Both of these graphs intuitively make sense to me!
There won’t be a BLOG post next week, due to the Christmas holiday. Thanks for reading everyone!